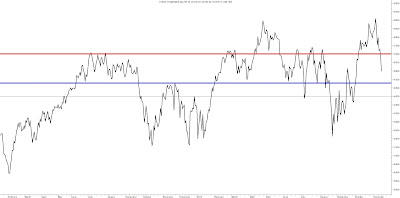
Last weekend's perspectives note played out during the course of the week as the T40 broke major support breaking to the downside. The weekly graph reflects how price reversed off the higher bollinger band as the stochastic crossed bearishly over its signal line. What now needs to be considered is the extent of the downward move. The stochastic still looks highly bearish and in this longer time-frame basis further downside appears to be on the cards.
The daily chart shows - via the stochastic - how oversold the T40 is following the last week's sell-off. However, at this stage there is really no sign of a reversal on the cards either in the slope of the stochastic, which is pointed firmly downwards, or in the daily candle formations which are very bearish.
On the support and resistance front, with the break of the support around the 47,000 level (now flagged as a red resistance line) we are now eye-balling the next support level at around the 45,300 - 45,500 level.
Putting all of this together to plan for the week ahead. At the outset we'd be looking to continue letting our shorts run as far and as hard as possible, treating any long trades as counter-trend and therefore taking quick profits if these setups do materialise. However if the market does start approaching the 45,300 level we need to be a bit more wary even on the short side as the sell-off has been fairly substantial so some consolidation could be on the cards around major support levels leading to choppiness. In that case, we'd look to take profits on short setups as well unless there's a decisive break of support .


A rather surprisingly bullish day as the T40 now looks to be starting to move off oversold conditions on a daily timeframe creating a swing low at around the 46,000 level. While some consolidation was anticipated, this came through earlier in the week than anticipated and now monitoring that 46,000 level will be important in the short-term to establish potential lateral support.
ReplyDeleteThe bulls followed through today despite the weak resources sector and the stochastic and candle formations on the daily charts are pointing towards further upside as the 46,000 level is confirmed as support. Resistance is now at 47,000 and in order for further upside to be on the cards there needs to be a break and close above that level.
ReplyDeleteA slightly nothing day with the stochastic still supportive of short-term upside but for now some channel boundaries can probably be drawn between 46,000 and 47,000 creating some natural target support and resistance levels to shape the targets from any intraday trades
ReplyDeleteThe short-term upside did materialise with a positive move on the day but as noted, the 47,000 level held firm and the index came off its intraday highs by the close without convincingly being able to breach that level. The daily stochastic remains bullish so the situation as painted yesterday remains in play. Further upside needs the 47,000 level to be sustainably broken with the 46,000 level providing support at the other end. It would not be surprising to see the index just chopping between these levels as the week ends
ReplyDelete