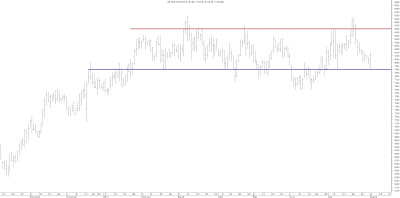
AVI is presenting another potential trade opportunity. The longer-term trend on the stock still remains bullish with the 21 week EMA well above the 89 week EMA. The stock revisited its all time high level about 2 weeks ago but since then has pulled back and has dipped below its 21 week EMA in the "buy-zone"
On the daily charts, the pullback pushed the stochastic oversold but with the stock finding support around the 61.8% retracement level, the stochastic has now moved back up over its signal line. Today we saw a very bullish engulfing candle being painted despite the weaker overall market setting up a potential move back up.
The support and resistance levels on the daily chart also quite clear with strong overhead resistance at the R85.00 level and equally strong support coming in at R79.00.
Our setup is to enter the trade around the R81.00 level setting a target of R85.00 and a stop as a close below R79.00 yielding a 2-1 target reward-risk ratio. Today's closing price is above that level so we would need a pullback intraday in order to achieve the desired target reward-risk level


This trade is still chopping around the channel bottom. The trade remains viable though so its not the worst plan to stay in position for now
ReplyDelete