Wednesday, September 2, 2015

Post-mortem: 100 live trades on the 3LB Trading System

Well actually it was 101 live trades but that's neither here nor there. The number does however allow for some early and essential caveats to all else that follows. 100 (or 101) trades is a very small statistical sample and caution should be taken in extrapolating outcomes over a limited sample and limited time period. Also, what is reflected below is the result of actual live trading outcomes and as such there are trading errors, missed trades, slippage and all the other realities of a manually executed trading system in the final outcomes. (I'll try and reflect a  bit more on these elements and our plans around them later in this post)

All of that said, I do believe there are some interesting trends which have developed over the past few months and that certain findings can well assist in making some positive system optimisation improvements. But lets get into the meat of this thing:

Frequency and results
We've been live trading the 3LB system since 18 May 2015. In the period 18 May to 01 September, we've entered 101 trades which equates to roughly 1.2 trades per trading day. Of that 101 trades, we had 36 winners, 45 losers and 20 break-even trades. 

Importantly we define break-even trades as those which yield a profit or loss less than  0.2 x initial risk adopted. (So as an example if we risk 1% of capital on a trade and we lose 0.1% in the result, this is bundled with the break-even trades). To test the relevance of this threshold, aggregating all the defined break-even trade results shows that the 20 break-even trades cumulatively lost 0.4% of average capital over the 3.5 month period - acceptable as immaterial.

 So our ratio of wins to losses (excluding the break-even trades) comes in at 44.4% at an average reward-risk of 1.91-1 

The equity curve for this result is shown below:


Note that for each trade we defined our permissible risk as 1% of the monthly starting capital and the y-axis reflects the cumulative % capital aggregation. What's interesting is to note the challenges experienced mainly during the July with the 8% draw-down between 7th July and 28 July. Even with this limited sample we can start seeing and experiencing a taste of how challenging it can be to stick to one's system in such a time.

The risk and reward trade histogram for each trade is as follows :


We can see from a discipline front, when executing systems trades we've been relatively good at managing and sticking to the 1% risk rule. On the return side, the frequency of hitting the 1%, 2%, 3%+ levels is quite interesting and its something we will revisit in the optimisation section of this post.

But on balance, not the worst set of results but its within the detail that we start seeing some interesting outcomes.

Across the Trading Day
As a general rule, we've entered trades after the market open (from 09h00) up until the market close (17h00). Where there have been un-triggered setups as at the close, we've left the orders in place to trigger and play out post-market. However eye-balling our results, it became apparent that there were fairly disparate outcomes depending on when during the day a trade was opened. To analyse this further we divided the trading day into 5 distinct zones defined as follows:


  • Opening (pre 10h00)
  • Morning (10h00 - 13h00)
  • Lunch (13h00 - 14h00)
  • Afternoon (14h00 - 16h00)
  • Close (post 16h00)


The outcomes after stratifying the results into these categories were as follows:


What's pretty clear even in our limited sample is that by simply not taking any trade entries before 10h00 and after 16h00, we immediately enhance both our win-rate and also positively impact our overall reward-risk ratio. What was surprising was the lunchtime results but the sample in that space was so small that this could well be an anomaly

Target versus Trail
The 3LB base system uses a step-trailing system and very often we see trades move profitably and then reverse as the steps can be quite substantial. This begged the question around whether it might not be better to set fixed targets and to forgo swinging for the fences on the huge moves by using the trailing stops in isolation. To answer this we looked back to the trade histogram (for a massive sample we could perhaps use some form of normal curve but we're really only dealing with 36 winners here so I think that's a bit premature) and noted the following return levels by winning trade:


What's clear is that the majority of the outcomes for winning trades fell into the 1% - 2% range. Given that our step-stop moves in 1% average increments  (when we hit 1% we ratchet the stop to break-even, at 2% we lock in 1%, etc, etc) this would mean that on average our trades peaked between the 2% and 3% level. So a rough optimal trade target should be at approximately the average of this range - say 2.5%. But what would the individual trade outcomes have been had we set that target level alongside the trailing stop which we still want to retain to lock in profits and preserve capital. We'd have fewer big spikes but given these compromise a relatively low proportion of overall winning trades, it should be more than compensated for by a general increase in the level of the majority of the trade outcomes. So definitely something to consider building some optimisation around.

Slippage and error
The nutshell summary is that this had a net cost of approximately 2.5% of average capital over the 101 trades. Sources ranged from trade mis-sizing to entry and exit slippage. Unacceptably high at the moment and an area of focus moving forward.

Changes for V1.1
Based on all the findings above,  the following tweaks will be incorporated into V1.1 of the 3LB system. Note that no wholesale changes can be made - its been re-iterated a few times that 100 trades does not provide a sufficient basis for that.

  • No trades will be taken before 10h00 and after 16h00
  • All trades taken during the "Morning" session as defined above will in addition to the step-stop include a 2.5x fixed target. The rationale here is that the impact of the US open in the afternoon session can really enhance momentum and we don't want to lose out on this by capping gains. Conversely post the open, the morning sessions tend to dwindle off so locking in quicker profits should be more optimal.
  • All positions still open as at the market close (17h00) need to be closed out manually by 17h30. We don't want to hold these positions overnight and if the last trade is entered into before 16h00 it has some time and space  to move positively before the close failing which the timed close is actually ideal.
  • Reducing mobile trading and looking to manually enter on more trades (as opposed to the stop orders) should reduce the slippage factor.

And that's it. Welcome any input on the above and look forward to the next 100 trades!

Sunday, August 30, 2015

Tiger Brands Short Setup

I was eye-balling a short on this stock a few weeks back and again there are signs of a potential opportunity to take a short position with the price action exhibiting many similarities to the setup at that time.

Looking at the weekly chart as a starting point, the signals are a bit mixed with the stochastic chopping around in a  fairly neutral zone. The moving average positioning of the 21 EMA and 89 EMA remains bearish but we can see a bit of a pullback into the space between the moving averages with the painting of a bullish engulfing candle at the end of last week.


The daily chart is reflecting more definitive short signals with the overbought stochastic starting to flatten out. Price has also retraced 100% of the move from its previous swing high and we have a bearish daily candle on Friday.


The support and resistance graph shows the recent range in which the price has fluctuated with the lateral resistance zone between R300 and R294 still well intact. There is a support level at around the R270 level as well.


Setup would be a short entry at around the current price level with a target at the R275 level and a stop above R300 - this would yield a reward-risk of around 4-1. Based on the some of the mixed signals I'm giving this setup a 61% grading.

Tuesday, August 18, 2015

Investec - Long Trade Setup

Looking at the Investec weekly chart as at the end of last week, we see that the stochastic was coming off near overbought levels and was heading into a potential buy-zone between the 21 and 89 EMA levels. The price trend on this stock on this longer-term basis is still very clearly bullish. We would thus be looking for a move down below the R110.00 level for a reversal.


On the daily charts we see this move down into the buy-zone and subsequent reversal playing out over the last few days. The stochastic moved oversold and with the painting of a bullish engulfing candle today has now started reversing back upwards over its signal line.


This graph clearly shows the longer-term bullish trend in place and also shows a strong support line where the price is currently reversing off.


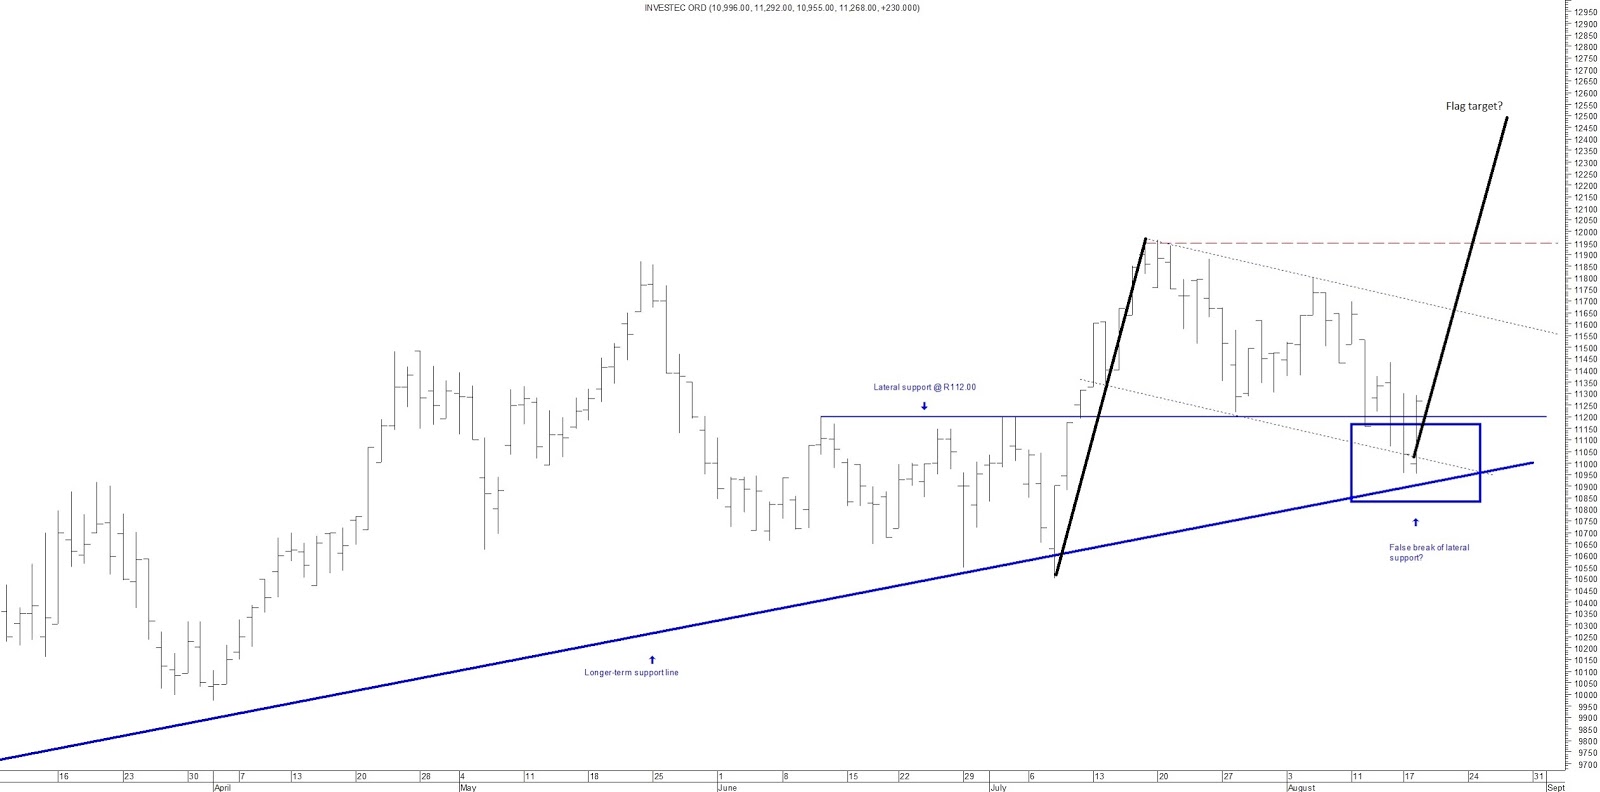
The next graph is very busy but we can see a number of factors which cumulatively start supporting the high probability trading case here. First we can see the longer-term support line as per the previous graph coming in at the base of this one providing a good underpinning support level. There is a softer lateral support level coming in at R112 which was broken int he past few days but with the potential reversal on the cards, this could be viewed as a false break - which is quite bullish. Lastly we have a potential bullish flag pattern in place which if it plays out could see price targets coming in at the R119.50 and R125.00 levels.


Setup is as follows. Look to enter the long around the R113.00 level or better with a stop coming in as a close below R109.00. Initial target will be R119.50 with a secondary target at R125.00. This should yield an average target reward-risk of 2.6-1

Thursday, August 13, 2015

Mr Price Long Trade Setup

As at the end of last week we saw Mr Price's weekly stochastic coming off of near overbought levels.Last week's candle was in fact quite ugly with a horribly long wick - pointing to potential weakness coming into this week. At the same time the stock has a clear strong trend in place with the 21 week EMA well above the 89 week EMA. The ideal pullback would be into the "buy-zone" between these 2 levels (a range between R215 and R245) as can be seen looking at the pullbacks over the past 12 months.


On the daily charts we can clearly see how this expected weakness played out during the course of this week with the price pulling back sharply and pushing the stochastic oversold. Today we saw price regaining the 100% retracement level (from its 05 August swing high) and the stochastic has now started moving bullishly from oversold conditions with the painting of a hammer candle formation on the day.


The support and resistance chart sees a very solid upward sloping support line going back over the past year which has been tested and respected by price a number of times. We can also see the top of the channel being shaped by a series of higher highs formed over the past few months.

Our setup will be to aim to enter around current price levels with price targets at R260 and R265 levels respectively. Our stop-loss would be a stop below R239.00 level. Average target reward-risk comes in around the 2.4-1 level.

Tuesday, August 11, 2015

City Lodge Long Trade Setup

On a weekly basis this stock has struggled to find direction in the short-term (this is further verified by a fairly listless stochastic) although the longer-term trend remains firmly bullish with significant headroom between the 21 week EMA and the 89 week EMA. As at the end of last week, we saw price close just below the 21 week EMA in the potential buy-zone


Drilling down into the daily charts we can see that price has moved to between the 61.8% and 100% retracement level from the high of 15 July 2015. The stochastic has also moved oversold but is now looking to break back up above its signal line with the painting of a near bullish engulfing candle today. What is however concerning is that the 21 day EMA is looking to potentially crossover negatively below the 89 day EMA so a quick recovery will be needed from here on in.


On the support and resistance graph we can see a nice little support wedge coming in for the stock around the current levels with overhead resistance at around the R148.00 level.


A potential setup would be to enter the long on a break above the R140.00 level setting the stop as a close below the current day's low of R136.50 with the view to targetting the R148.00 resistance level. Such a setup would yield a 2.2-1 reward-risk.

Thursday, August 6, 2015

Mindfulness in trading

We’ve all experienced that response - the sinking sensation as we enter the trade on cue; watch it move into the money then do a quick reversal to juuust stop us out….before moving back into the money and hitting our target level. Why is it that the majority of the pain in that response comes from what happens after we get stopped out – when we are no longer in the trade? I put it down to an action-reaction instinct which is hard-wired into our make-up from a very early age. If we did well at school we got rewarded as a child. If we live good lives, we are told that we will be rewarded in the after-life. We work hard at our jobs and (sometimes) we get the bonus. Action and reaction. The pain we feel in the scenario sketched above comes from a breakdown of that axiom. Doing the correct thing and NOT getting what we regard as the just reward. So how do we bypass this hard-wired response? I think the answer lies less in the attempt to suppress the response but more in the mindfulness associated with appreciating that the response will take place, observing that it is taking place and simply understanding why it is occurring. Once we are able to naturally go through this process time after time, the energy behind the response tends to dissipate and we can safely take the next step in our trading career.

Monday, August 3, 2015

AVI Long Setup

AVI is presenting another potential trade opportunity. The longer-term trend on the stock still remains bullish with the 21 week EMA well above the 89 week EMA. The stock revisited its all time high level about 2 weeks ago but since then has pulled back and has dipped below its 21 week EMA in the "buy-zone"


On the daily charts, the pullback pushed the stochastic oversold but with the stock finding support around the 61.8% retracement level, the stochastic has now moved back up over its signal line. Today we saw a very bullish engulfing candle being painted despite the weaker overall market setting up a potential move back up.


The support and resistance levels on the daily chart also quite clear with strong overhead resistance at the R85.00 level and equally strong support coming in at R79.00. 


Our setup is to enter the trade around the R81.00 level setting a target of R85.00 and a stop as a close below R79.00 yielding a 2-1 target reward-risk ratio. Today's closing price is above that level so we would need a pullback intraday in order to achieve the desired target reward-risk level