Looking at the weekly chart we see that the stochastic has worked off its overbought condition but is still pointing firmly downwards. The weekly candles really only reflect the sideways chop consolidation the market has been experiencing over the past few weeks making it difficult to see a clear direction materialising.
Countering this outlook is the potential recurring seasonal impact of the "santa clause rally". Looking back at the past 2 years, its worth noting that this has kicked in later and later with the market pivoting off a low in the week of 13 December and 17 December in 2013 and 2014 respectively. From that perspective, we still have a couple of weeks of further potential weakness in the making at least assuming we have a breakdown playing out here.
Worth noting at this point is also a post I did on twitter a few weeks back
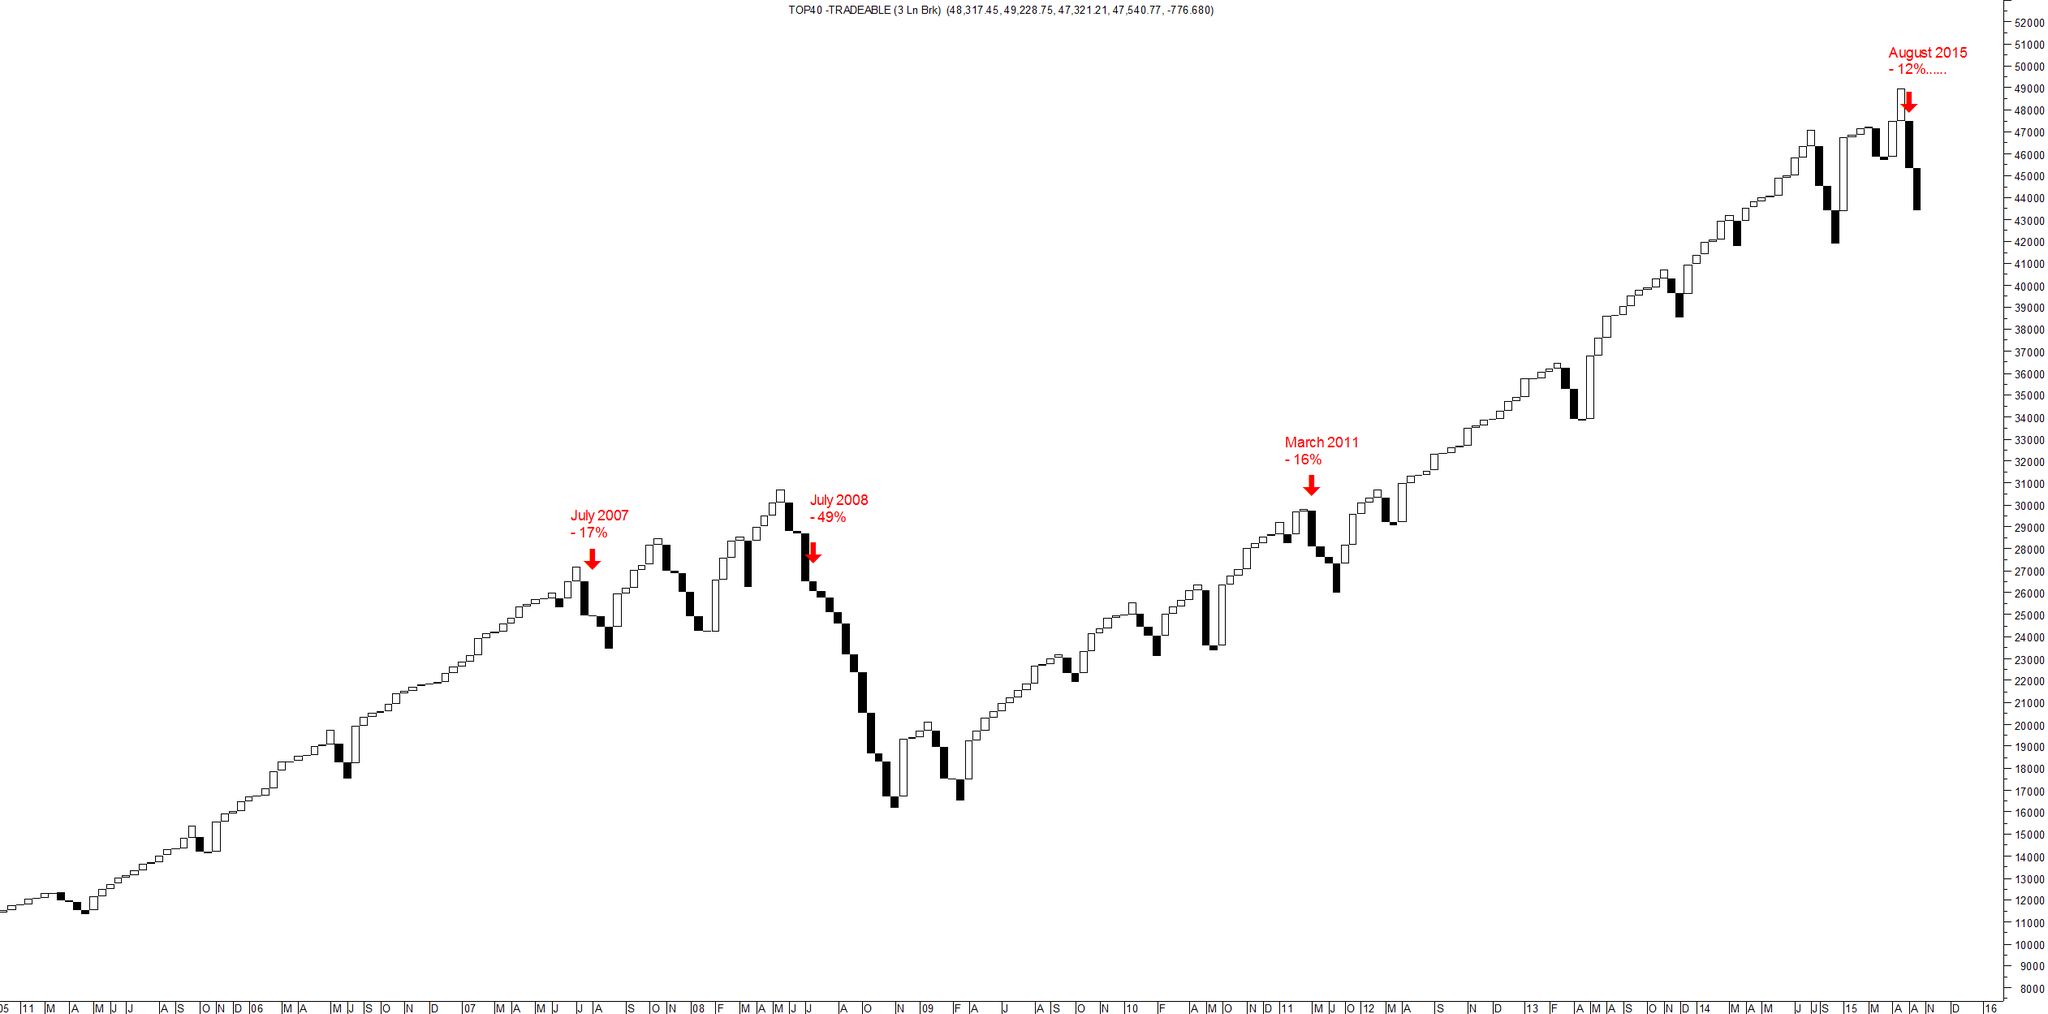
What this shows is the % drop from high to low that the market took following a break of the swing low on a 3LB weekly chart. Interestingly, in the last 10 years, the weekly 3LB has only broken down 4 times (July 07, July 08, March 11 and then most recently in August 2015). Of all of these, the high to low originating in August 2015 has to date been the the most moderate with the market reversing but only 12%. Again nothing conclusive can be drawn form this observation but it adds another notch to the bearish outlook that further downside could be on the cards.
Drilling into the daily chart, we can see the T40 in a consolidation holding pattern at the moment with the stochastic meandering a bit aimlessly in neutral territory. There's also a slightly disturbing potential triangle formation in the making which if breaking down, could see a significant downside move in the making.
The daily closing support and resistance view shows how the 47,000 level has resisted the upwards break as the T40 remains range-bound within the major channel as highlighted.
Overall its not a clear picture at the moment. The potential for downside over the next couple of weeks appears real unless the market can find support around the 46,000 level again. If that support level fails the 45,300 area will be critical or we may see the triangle break highlighted above playing out and could well see the prior lows being revisited int he medium-term. On the flip-side, if the T40 could break and hold the 47,000 level, the bulls could force the year-end rally to play out with potential for further upside back towards historical highs. In the short-term we'll trade this analysis by keeping targets tight and fixed while we're in the 45,500 to 47,000 range for both longs and shorts. If we breakout of that range we'll be more inclined to let trades run.


The daily stochastic is now pointing firmly downwards without being oversold as yet and we could be seeing the start of a breakdown out of the triangle formation. While the 46,000 level remains intact we're not completely going bearish yet though and on an end of day basis the T40 remains bound in its range. We remain wary watching for a potential breakout near the edges of this channel though
ReplyDeleteAnother bearish candle has seen a breakdown out of the triangle structure targeting a move towards a rather distant-looking 43,000 level. In the short-term the daily stochastic is now oversold but there's no evidence of a reversal as yet and the T40 needs to now bounce off the 46,000 level which could result in a temporary reprieve throwback to the underside of the triangle at around 46,500. Alternatively further weakness could see 45,000 - 45,200 as the next support range. The bears have the initiative at the moment so the trade approach is quick profits on the long side while letting the shorts run as far as possible
ReplyDeleteThe breakdown had some follow through with downward momentum today and as expected, the T40 is now approaching the 45,000-45,300 support level. The stochastic remains oversold but is still pointing firmly downwards and unless the market finds some kind of support tomorrow, we could well see a breakdown of that fairly strong support level noted in the support and resistance graph above. If that happens, it adds further credence to the notion of the 43,000 triangle breakdown target being in sight.
ReplyDelete